Nutrient Recycling Potential Calculator for Households Using Integrated Decentralised Wastewater Treatment Systems

RUVIVAL Calculator

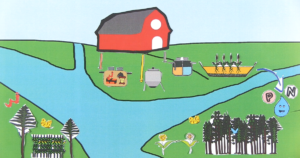
The following calculator provides the user with the opportunity to estimate the potential fertilisation area, if faeces and urine from a household are applied. The recommended integrated decentralised wastewater system would use this fertilisation potential for non-food plants and long term soil enrichment.

Nutrient Recycling Potential Calculator

Faeces Application:

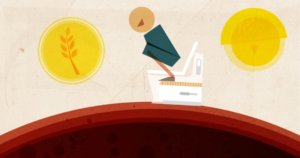
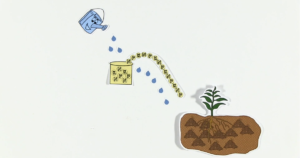
Faeces are rich in phosphorous (P), potassium (K) and organic matter and can contribute to non-food crop production both by their fertilising effect and by their soil-improving effect. The proportion of nitrogen that is in mineral form in faeces varies largely between the different purification strategies and can be lost in form of gases. Therefore, only the Phosphorus-fertilisation of Terra Preta Sanitation compost is considered.

Please find more information in this literature review.

Please Enter The Number of Household Members:

Yearly Faeces Production
per Household (kg/a):

Yearly Phosphorus-Fertilisation Area of Terra Preta Sanitation (TPS) compost per Household (m2/a):

Yearly Organic Content Supply Area of  TPS compost per Household (m2/a):

Urine Application:

RUVIVAL Urine Application Calculator

Urine contains four important nutrients for plant growth: nitrogen (N), phosphorus (P), potassium (K) and sulphur (S). The direct application of nutrient-rich sanitised urine to the soil for non-food crops provide the opportunity to recover the nutrients and also reduce the use of fertilisers. The urine application calculator tool developed by RUVIVAL calculates the potential urine fertilisation area of a household based on the yearly production of urine.

Click On the Calculator Icon to Access the Urine Calculator

More information about urine application can be found here.

Background of the Calculator

Excreta ValuesValuesUnit 
Daily Faeces Production per Person140g/d(grams per day)
Yearly Faeces Production per person51.1kg/a(kilograms per year)
Yearly Amount of Nitrogen in Faeces per Person550g/a(grams per year)
Yearly Amount of Phosphorous in Faeces per Person183g/a(grams per year)
Phosphorus Fertlisation of TPS Faecal Compost per person900m²/a(square metre per year)
Yearly Organic Content Supply Area of TPS compost per person4.5m²/a(square metre per year)

According to Jönsson et al. (2004), the potential yearly amount of nitrogen and phosphorus in faeces per person in Sweden is 550 g/(a·person) of nitrogen and 183 g/(a·person) of phosphorus. The yearly amount of nitrogen and phosphorus in faeces per household is calculated from the potential yearly amount of nitrogen and phosphorus in faeces per person multiplied by the number of household members.

According to research done in Tanzania by Krause et al. (2015), total phosphorus in TPS compost is found to be 3.6 times the total phosphorus in faeces compost. The yearly faeces fertilisation area of TPS compost per household is calculated from the potential yearly fertilisation area of faeces per person (900 mfor phosphorus) multiplied by the number of household members. The yearly organic content supply area of TPS compost per Household is calculated from the potential yearly organic content supply area of TPS compost per person (4.5m2 /(a·person)) multiplied by the number of household members.

This calculator takes as a reference point the research done by Jönsson et al. (2004), the amount and nutritional value of faeces and urine are based on the data of the Swedish population. It is important to note that amount and nutritional values of faeces and urine are subjected to variation in different regions of the world and are highly dependent on the nutrient uptake and diet of the population. The nutritional value of wastewater streams improves the quality of the urine and faeces to be used as fertilisers for non-food crops.  Therefore, the provided results should only be considered as a reference point when referring to the potential for nutrients recycling in integrated decentralised wastewater treatment.

The values used in this calculation tool are based on the following studies.

Jönsson, H, Richert, A, Vinneraas, B & Salomon, E 2004, Guidelines on the use of urine and faeces in crop production, EcoSanRes Publication Series, 2nd edn, Stockholm Environment Institute, Stockholm, Sweden.

Krause, A, Kaupenjohann, M, George, E & Koeppel, J 2015, ‘Nutrient recycling from sanitation and energy systems to the agroecosystem- Ecological research on case studies in Karagwe, Tanzania’, African Journal of Agricultural Research, vol. 10, no. 43, pp. 4039–5.

Nutrient Recycling Potential Calculator for Households Using Integrated Decentralised Wastewater Treatment Systems by Usama Khalid and Ruth Schaldach is licensed under a Creative Commons Attribution-ShareAlike 4.0 International License.


Water Saving Potential Calculator for Households Using Decentralised Wastewater Treatment Systems

RUVIVAL Calculator

The following calculator tool provides the opportunity to estimate water savings for a household through reuse of the greywater, using the recommended integrated decentralised wastewater system. Separately collected, a less concentrated greywater stream could serve as an alternative irrigation water and flushing water source after minor on-site processing.

For more information on recommended decentralised wastewater system and its proper management, please have a look at further materials provided here.

Water Saving Potential Calculator

Number of Household Members:

Water Savings per Day from Greywater Reuse and Low-Flush Toilets per Household (l/day):

Yearly Water Savings from Greywater Reuse and Low-Flush Toilets per Household (l/year):

Background of the Calculator

According to Friedler (2004), greywater reuse could decrease the water demand of a household by 48 % and lead to water savings of up to 70 litres per person per day. The yearly water savings from greywater reuse and low-flush toilets per household (l/year) is calculated from the potential daily water savings from greywater reuse and low-flush toilets per person (48 % of daily water use i.e. 70 l/day) multiplied by the number of household members and 365 days.

The value of average daily water use per person is taken to be 146 l/day per person, however, the value is subjected to variation for different regions of the world. The provided results should be considered just as a reference point when referring to the potential for water reuse in integrated decentralised wastewater treatment.

Friedler, E 2004, ‘Quality of individual domestic greywater streams and its implication for on-site treatment and reuse possibilities’, Environmental Technology, vol. 25 no. 9, pp.997-1008.

Water Saving Potential Calculator for Households Using Decentralised Wastewater Treatment Systems by Usama Khalid and Ruth Schaldach is licensed under a Creative Commons Attribution-ShareAlike 4.0 International License.


Soil Erosion Calculator

RUVIVAL Calculator

The average annual rate of erosion on a field can be predicted with the use of the Universal Soil Loss Equation (USLE). This equation integrates the local rainfall pattern, soil type, topography, crop system and management practices. The following Soil Erosion Calculator is a Tool to calculate the average annual rate of erosion. It is based on the USLE equation and can be applied globally.

Nevertheless, the USLE equation and thus the Soil Erosion Calculator has two main limitations that need to be considered. Firstly, the calculator is an estimate based on ample and variable factors. These factors may vary with changing climate conditions, alternating usage of the soil, etc. Therefore, the resulting soil loss must be viewed as a long-term average. Secondly, the calculator only accounts for soil losses due to sheet or rill erosion on a single slope. Soil losses associated with gully erosion, wind erosion or from tillage are not included.

Soil Erosion Calculator

1. Erosivity Factor (Rainfall Factor) [(MJ mm) / (ha h yr)] – Slide 2-3:

2. Soil Erodibility [(t / ha)] – Slide 4-5:

3.1. Slope [%] – Slide 6:

3.2. Slope Length [m] – Slide 6:

4. Crop Type Factor[-] – Slide 7-8:

5. Tillage Factor [-] – Slide 7-8:

6. Support Factor [-] – Slide 9-10:

Annual Average Soil Erosion Rate (t/h/yr):

After calculating your Soil Erosion Rate, you can use the following table to find out about your Soil Erosion Class. Depending on your class, you may consider to implement Soil Erosion Strategies on your field. Play around with the factors you inserted priorly, to see if there is a particular factor that influences your Soil Erosion Rate strongly.

There is a computerized version of the USLE equation, named Revised Universal Soil Loss Equation (RUSLE). RUSLE is an improved formula, that can handle more complex combinations of tillage and cropping practices and a greater variety of slopes. A further-enhanced version the software is RUSLE2, which can do event-based erosion prediction. RUSLE2 requires a comprehensive set of input information, which may not be available in all jurisdictions.

The Water Erosion Prediction Project (WEPP) is a physically-based soil erosion prediction technology. It integrates hydrology, plant science, hydraulics and erosion mechanisms to predict erosion at the hillslope and watershed scale. It is capable of modelling and assessing a variety of land uses, climate and hydrologic conditions. It can be run offline on personal computers supporting Windows.

Soil Erosion Calculator by Antonio Seoane Dominguez and Ruth Schaldach is licensed under a Creative Commons Attribution-ShareAlike 4.0 International License.


Urine Application Calculator

Urine contains four important nutrients for plant growth: nitrogen (N), phosphorus (P), potassium (K) and sulphur (S). Urine application can not only recover these nutrients, but also reduce the use of complete fertilisers and freshwater, as well as minimise the contamination of surface and ground waters by wastewater and excreta.

However, if urine is not managed properly, the risk of pathogen transmission, soil salinisation and pharmaceutical contamination, as well as strong and offensive odour can cause significant health problems and discomfort. Other challenges that have to be addressed are separation techniques, storage time, amount of urine to be applied, odour prevention and transport. Find out more in the literature review.

This tool calculates the collectible urine volume per household and gives the user the potential fertilisation area for the amount of calculated urine. For more information on urine utilisation and its proper management, have a look at the further materials provided in the Toolbox.

Please keep in mind that the application rate of urine depends not only on its nutrient content, but also on the main goal of urine utilisation: N-Fertilisation or P-Fertilisation.

Urine volume and fertilization area calculation

Number of Household Members *:

Yearly N-Fertilisation Area
per Household (m2/a):

Yearly Amount of Nitrogen in Urine
per Household (g/a):

Yearly P-Fertilisation Area
per Household (m2/a):

Yearly Amount of Phosphorous in Urine
per Household (g/a):

The following table gives the background information the calculator uses:

Urine ValuesValuesUnit 
Daily Urine Volume per Person1.5L/d (litre per day)
Yearly Urine Volume per Person550L/a(litre per year)
Yearly Amount of Nitrogen in Urine per Person4000g/a(gram Nitrogen per year)
Volume of urine to be applied per squere meter (N-Fertilizer)1.4L/m²(litre per square metre)
Yearly N-Fertilization Area per Person400m²/a(square metre per year)
Yearly Amount of Phosphorous in Urine per Person365g/a(gram Phosphorous per year)
Volume of urine to be applied per squere meter (P-Fertilizer)0.9L/m²(litre per square metre)
Yearly P-Fertilization Area per Person600m²/a(square metre per year)

The Yearly Fertilisation Area per Household is calculated from the potential Yearly Fertilisation Area per Person (400 m2 for Nitrogen and 600 m2 for Phosphorous) multiplied by the number of household members.

The Yearly Amount of Nitrogen in Urine per Household is calculated from the potential Yearly Amount of Nitrogen in Urine per Person (4000 g/(a·person)) multiplied by the number of household members. The value for Phosphorous is calculated in the same way.

The values used in this calculation tool are based on Jönsson, H, Richert, A, Vinneraas, B & Salomon, E 2004, Guidelines on the use of urine and faeces in crop production, EcoSanRes Publication Series, 2nd edn, Stockholm Environment Institute, Stockholm, Sweden. This study takes as a reference point the average nutritional values for Sweden retrieved from FAO, which should be appropriated for the purposes of other countries. It is important to note that improved nutritional values also improve the quality of the urine as a fertiliser. The provided results should be considered just as a reference point, when referring to the potential for urine utilisation.

Urine Application Calculator by Andrea Munoz Ardila and Ruth Schaldach is licensed under a Creative Commons Attribution-ShareAlike 4.0 International License.


Rainwater Collection Calculator

RUVIVAL Calculator

Rainfall can be collected from any surface. Using a simple rainwater collection calculator, it is possible to find the amount of water that can be collected. Nonetheless, it is important to keep in mind that there are always losses when collecting/storing rainfall, such as evaporation and/or leakage, in addition to variations that can result from area specific weather conditions. In the following, these elements are not considered, yet they are a useful tool to get a general idea of the quantity of rainfall that can be collected.

This first rainwater collection calculator can be used to determine the maximum amount that can be harvested in general terms. A simple multiplication will provide the total possible rainfall that can be captured, based on answering the following questions:

  • How much does it rain annually?
  • What are the dimensions of the catchment area?
Maximum Rainwater Collection


Total possible rainfall capture (m3/year) = Precipitation (mm/year) · Dimension of Catchment Area (m2)

Precipitation (mm/year)*:

Dimension of Catchment Area (m2)*:

Total possible rainfall capture (m3/year):

Litres (l/year):

US Gallons (gal/year):

Average annual precipitation

Climate zonePrecipitation rate
Desert area0-100 mm
Semi-desert area100-250 mm
Arid area250-500 mm
Semi-arid area500-750 mm
Semi-humid area900-1500 mm
Humid tropics> 2000 mm

If you would like to discover more about RWH methods, one fun and easy tool is to create a DIY rain-gauge to measure rainfall in your area, or take a look at a rainfall map of the world designed by NASA, to get a better perspective of precipitation levels worldwide. NASA is also looking for support from students, professors and science-enthusiasts, who would like to collect data and support their Global Learning and Observations to Benefit the Environment (GLOBE) Program. Moreover, if you need specific data on precipitation, the UN has created a large database that can come handy.

Rainwater Collection Calculator by Claudia Lasprilla Pina, Mykyta Riabchynskyi, Rahel Birhanu Kassaye and Ruth Schaldach is licensed under a Creative Commons Attribution-ShareAlike 4.0 International License.

Collecting rainwater from rooftops

The following calculation will help to identify the amount of water that can be collected through rooftops, where the collected rainfall depends on 3 factors:

  • Area of run-off (roof area)
  • Surface run-off coefficient (depends on run-off area material)
  • Amount of precipitation (depends on climate in region)

The area of run-off refers to the footprint of the rooftop. This outline, as shown in the picture, will help to calculate the catchment area by simply multiplying the length by the width, which will provide its total surface; remember to also consider the area of the roof’s overhang when calculating.

Rainwater Collection from Rooftops

Runoff Coefficient for Rooftops

Roof Pavement TypeRunoff Coefficient
Iron Sheets> 0.9
(assume 1 for cold region, 0.98-0.99 for hot region)
Aluminium Sheets 0.8-0.9
Tiles0.6-0.9
Flat Cement Roofs 0.6-0.7
Organic0.2

Input the information provided in the tables above into the rainwater collection calculator, according to your region and rooftop material. The calculator will provide the solution to the following equation:

Supply of water in the storage tank (m3/year) = Rooftop area (m2) · Runoff coefficient · Precipitation (mm/year)

Rooftop Area (m2)*:

Runoff coefficient*:

Precipitation (mm/year)*:

Your supply of water in storage tank is in (m3/year):

Litres (l/year):

US Gallons (gal/year):

Rooftop Rainwater Collection Calculator by Claudia Lasprilla Pina, Mykyta Riabchynskyi, Rahel Birhanu Kassaye and Ruth Schaldach is licensed under a Creative Commons Attribution-ShareAlike 4.0 International License.

It may be of interest to you to have a further look at our DIY Rooftop Rainwater Harvesting Handbook, which explains step-by-step how to install a rain catchment system in your own house.